Introduction
CardIAP is an open-source Python web application that allows the user to set all necessary parameters for biomedical images analysis. CardiAP not only allows users to select the image's regions of interest but also to retrieve and explore the analysis output data. In addition, CardIAP can be used as a standalone python library.
The images that can be generated in the study of the heart have the particularity of requiring both spatial and temporal analysis. CardIAP aims to open the field of cardiomyocyte image processing and make an improvement in the extraction of information from the images allowing optimizing the usage of resources and animals.
With CardIAP, users can retrieve the average intensities of pixels across images and download the analyzed data. In addition, users can run the analysis to both, the complete image, or portions of it in an easy way, and replicate it on a series of images. This analysis provides users information on the spatial and temporal changes in calcium releases and characterizes them through indexes and ratios.
Images
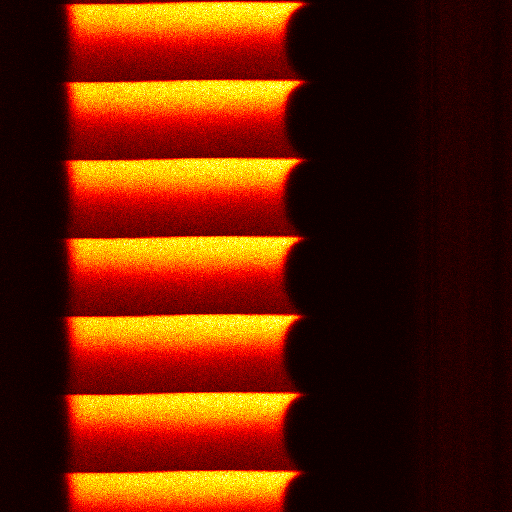
CardIAP is prepared to use confocal linescan images of electrically paced cardiomyocyte. Images must be vertically oriented.
Multiple images can be loaded. Each image must be in TIFF format and be displayed as monocromatic. If CardIAP does not recognizes the format of any image shows the message, "Please upload an image first"

User must select a ROI for each one. This ROI must include at least one peak and not include background.
Smoothing parameters
CardIAP enables the user to use a bilateral filter to smooth the image.
Kernel size: Diameter of each pixel neighborhood that is used during filtering. A value of zero allows not to filter the image.
Sigma: Filter sigma in the coordinate space. A larger value of the parameter means that farther pixels will influence each other as long as their colors are close enough. When d>0, it specifies the neighborhood size regardless of sigmaSpace. Otherwise, d is proportional to sigmaSpace. A value of zero allows not to filter the image.
Analysis parameters
Slice width: dividing the ROI into slices, these have the established dimension and the number of slices is equal to the width of the ROI divided by the chosen slice size. Keep in mind that the dimensions of the last slice will correspond to the rest of that division. This can't be zero.
Distance between maxs: It is a measurement in pixels that allows CardIAP to optimize the search for peaks. It does not need to be exact, so it can be estimated from the relationship between the size of the image and the number of peaks in it. This can't be zero.
Calibration: refers to a factor that relates pixels to time. This can be calculated from the image capture time.
Results
CardIAP analysis results are presented in differents tabs for the complete cell analysis, slices data tables and individual slices analysis.
Complete cell tab shows two tables. The first one contains all features calculated for each peak. In the second one are showed baseline data for each peak. Users can download both tables using links below each one.
In order for the user to have a graphic representation of the intensities of the photo, the plot of the average intensities versus time and the amplitude values for each peak are shown.
Discordance indexes and alternance ratio data are shown in a couple of tables. Local alternance ratio distribution is presented in boxplots.
Slices General Data tab has two links for downloading slices analysis results.
Slices details tab has a selector that allows you to select a slice to view the corresponding data tables and graphs.